On 20 April 2010 the Macondo well blew out while the Deepwater Horizon was temporarily abandoning it. Eleven people died and 17 were injured (CSB Volume 1). Sixteen years later it is still the case every drilling engineer should know in detail, because almost nothing about it was exotic.
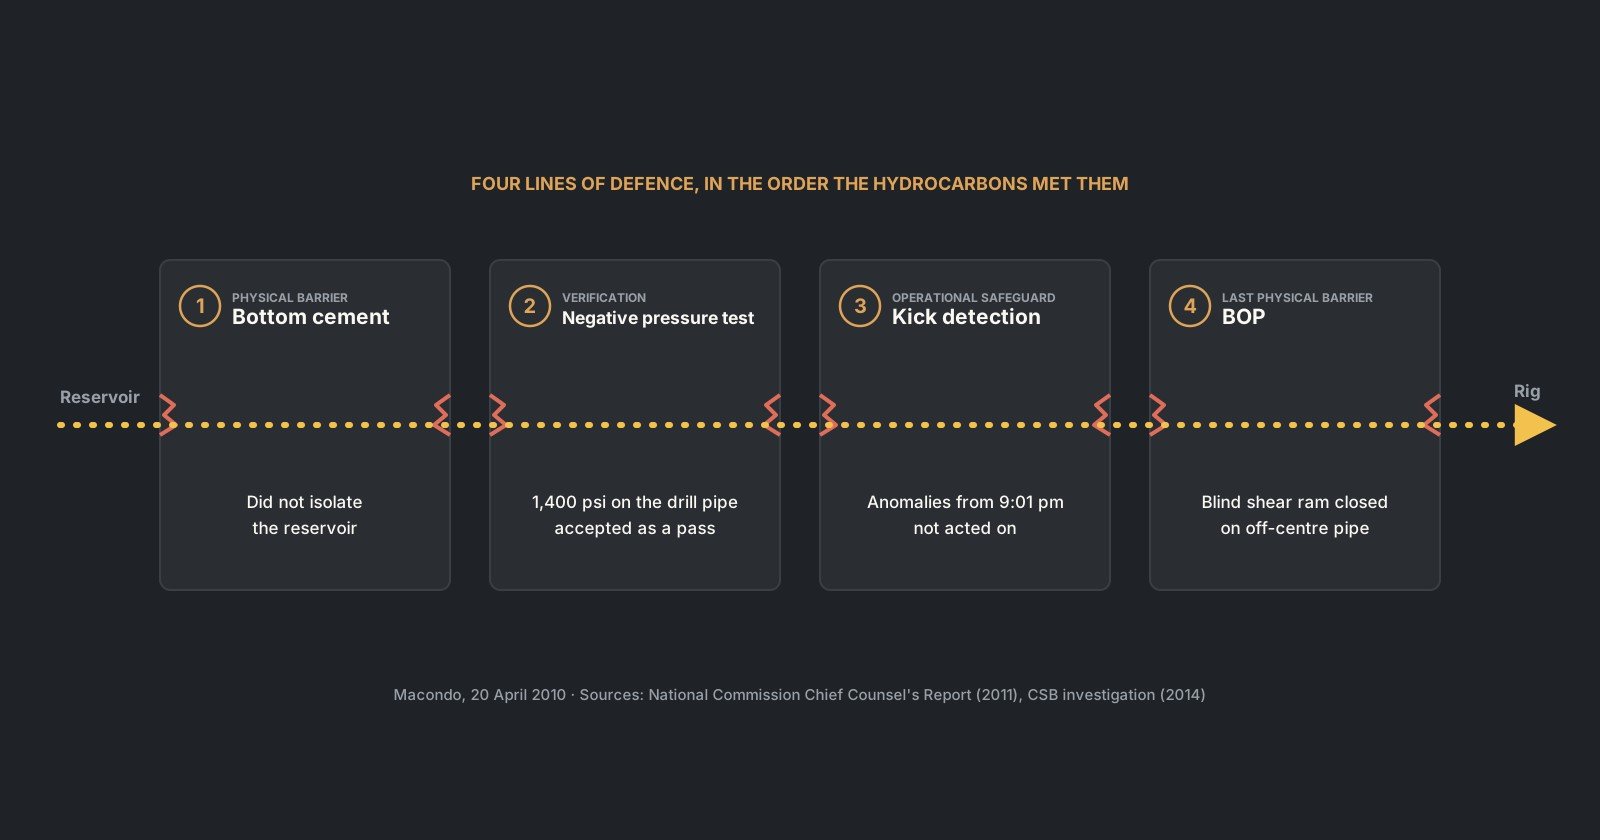
The well had several lines of defence between the reservoir and the rig. This article follows four of them in the order the hydrocarbons met them: the bottom cement, the negative pressure test, kick detection, and the blowout preventer. They are not all the same kind of thing. The cement and the BOP are physical barriers; the negative pressure test is a verification step; kick detection is an operational safeguard. The point is not that one thing caused Macondo, but that degraded physical barriers, failed verification, missed indications and an unsuccessful emergency barrier removed successive opportunities to stop the event.
Everything here comes from the public record: the Chief Counsel’s Report of the National Commission (2011) and the US Chemical Safety Board investigation (2014). Page numbers refer to those reports. The aim is not to assign blame, which the courts and investigators have done, but to read the well the way an engineer would.
In this article
- The well: a narrow window at the bottom
- Line of defence 1: the bottom cement (a physical barrier)
- Line of defence 2: the negative pressure test (verification)
- Line of defence 3: kick detection during the displacement (an operational safeguard)
- Line of defence 4: the response and the BOP (the last physical barrier)
- What a student or young engineer should take from Macondo
- Sources
The well: a narrow window at the bottom
Macondo sat in Mississippi Canyon Block 252, in 4,992 ft of water, 48 miles off the Louisiana coast (Chief Counsel’s Report, p. 25). The Marianas spudded it in October 2009 and drilled the first 9,090 ft; the Deepwater Horizon took over in February 2010 (p. 26).
The bottom of the well is where the trouble started. On 9 April the well lost returns at 18,193 ft with an equivalent static density of about 14.5 ppg (p. 60). The team needed roughly 14.0 ppg mud to balance the formation, but circulating that mud would give an ECD of nearly 14.5 ppg and risk fracturing the rock again. In the report’s words, they had “run out of drilling margin” (p. 60). Total depth was called at 18,360 ft, short of the 20,600 ft objective.
That is the ECD article in real life. A density margin of only about 0.5 ppg at that depth corresponds to roughly 473 psi of pressure difference:
ΔP = 0.052 × 0.5 ppg × 18,193 ft ≈ 473 psiMany of the later cement-design and execution decisions (low volume, low pump rate, light foamed slurry, limited circulation) were shaped by the need to avoid exceeding that narrow window.
The casing choice
The production string was a long string from the wellhead to the bottom: 9⅞ in. casing down to 12,488 ft, then 7 in. to the bottom (pp. 47, 58). The alternative was a liner hung from the previous casing, tied back to the wellhead later. BP chose the long string on 14 April. It cited several technical and completion considerations, including the original design basis, trapped annular pressure concerns and avoiding an additional mechanical seal, as well as an estimated $7 million to $10 million saving in future completion costs (pp. 58, 61).
The engineering trade-off is about barriers. With a long string, the only seal in the annulus at the bottom is the primary cement, backed by the casing hanger seal at the wellhead. A liner adds a liner-top seal and, later, cement behind the tieback. Neither design is wrong in itself, but the long string put more weight on one cement job in a well with almost no margin.
The temporary abandonment plan
The plan was to leave the well for a production rig to complete later. BP planned a 300 ft surface cement plug about 3,000 ft below the seafloor, set in seawater rather than mud (CSB Volume 1, p. 25). To do that, mud would be displaced with seawater down to 8,367 ft (p. 26). Seawater is much lighter than the 14 ppg mud, so the displacement would deliberately reduce the hydrostatic contribution of the drilling fluid before the surface plug was installed. The Chief Counsel’s team listed this as a technical finding: the procedure called for severely underbalancing the well before other barriers were added (p. x).
Line of defence 1: the bottom cement (a physical barrier)
The primary cement did not isolate the reservoir. The Chief Counsel’s team calls this undisputed and the root technical cause, although the exact failure mechanism was never determined (pp. x, 95). Hydrocarbons most likely came up inside the casing, through the shoe track (pp. 95–97).
The job was designed as a “finesse” job to protect the weak formation (p. x). Each choice reduced the risk of losses and added risk to the seal:
| Design choice | Why it was made | What it cost the barrier |
|---|---|---|
| Nitrogen-foamed slurry, middle slurry lightened from 16.74 to 14.50 ppg (p. 81) | Lower density, lower ECD during cementing | Foam stability was a known challenge; internal Halliburton tests showed the slurry was unstable (pp. 81, x) |
| Small volume: about 39 bbl of foamed cement (48 bbl after foaming) between short lead and tail slurries (p. 93) | Less height of heavy fluid in the annulus | Little margin for contamination with mud |
| Low pump rate and limited circulation before the job (pp. 49, 98–99) | Lower friction pressure, lower ECD | Mud and cuttings less likely to be cleared from the annulus |
| Six centralizers run; models had predicted less channelling with 10 or 21, and BP’s earlier plans called for 11 to 16 (pp. 82–86) | The reasoning is set out in the report (pp. 82–86) | The April 18 model predicted “SEVERE” gas flow potential and mud channelling (p. 86) |
These factors increased the risk of poor zonal isolation, but the investigation could not conclusively identify a single mechanism that caused the cement barrier to fail.
The float equipment added doubt. The crew needed an unusually high 3,142 psi to convert the float valves, and the well site leader worried they had “blown something higher up” (p. 51). The report notes that the floats may never have converted and that float equipment is not a reliable barrier anyway (pp. 99–100, 103).
Finally, the cement was not evaluated. The plan required a cement evaluation log only if returns were lost or no lift pressure was seen. Returns were full and lift pressure was seen, so the logging crew was sent home on the morning of 20 April (pp. 94–95). Full returns show that the cement went where it was pumped without losses. They do not show that it set into a seal.
The engineering lesson: in a narrow pressure window, measures taken to reduce cementing ECD can introduce trade-offs elsewhere in the job, particularly in displacement efficiency, slurry design and placement. Those trade-offs have to be engineered and verified rather than assumed away. At Macondo the next check was the negative pressure test.
Line of defence 2: the negative pressure test (verification)
A negative pressure test reduces wellbore pressure to simulate an underbalanced condition and checks whether the relevant well barriers maintain isolation. At Macondo, the test provided clear evidence that the bottom barrier was not holding, yet the result was accepted.
What the gauges said
The crew displaced mud above the BOP with a 454 bbl viscous spacer made from lost circulation material, followed by seawater, then closed the annular preventer (Chief Counsel’s Report, p. 161; CSB Volume 1, p. 27). The procedures called for the test to be run on the kill line. It was first run on the drill pipe, which started at 2,325 psi and could not be bled below about 260 psi (pp. 161, 164). Pressure came back after each bleed.
The test was then moved to the kill line. There the kill line showed 0 psi and no flow, while the drill pipe still read 1,400 psi (p. 159). The test was declared a pass at about 8:00 pm (CSB Volume 2, p. 28).
Why those two readings did not fit together
Below the closed annular, the drill pipe and the kill line are connected through the same well. With the same fluids and both open to the same space, they should read the same pressure at the surface, apart from differences in the fluid columns inside them, restrictions or closed valves. A steady 1,400 psi on one and zero on the other could not both represent the same freely communicating wellbore condition under the assumed test configuration. One of them was not seeing the well.
The investigators concluded the kill line was the blind one. Spacer had leaked below the BOP and may have plugged the narrow 3⅛ in. kill line; with a clear line the crew would likely have seen 1,400 psi there as well (pp. 159–161). The drill pipe was reading the well, and what it read was formation pressure pushing up against a column that was lighter than planned. The pressure-balance logic resembles SIDPP in the kicks article: a closed string containing a known fluid can transmit information about pressure acting from below.
The anomaly was explained away as a “bladder effect”, a theory that pressure could build under the annular element without any flow. The report rejects it (pp. 158–159). It found the readings “not ambiguous”: a build-up from 0 to 1,400 psi on the drill pipe was, in the words of experts it consulted, a conclusive failure (p. 161).
Why it was misread
The report’s management findings are uncomfortable for anyone who has worked on a rig. Neither company had a standard procedure or training for negative tests; BP’s written step was simply “conduct negative test” (pp. 161–163). Nobody calculated the pressures and volumes to expect beforehand, the criterion used was “flow or no flow”, and nobody called the office (pp. 162, 164). The CSB adds that no acceptance criteria were given to the crew (Volume 1, p. 27).
The engineering lesson: a pressure test needs its expected numbers written down before it starts, including what each gauge should read and how much should bleed back. A result that does not match all of them is a failure until someone can explain every number.
Line of defence 3: kick detection during the displacement (an operational safeguard)
After the test was accepted, the crew began replacing mud in the well and riser with seawater, which lowered the pressure at the bottom of the well (CSB Volume 1, p. 27). The CSB reconstructed the influx as beginning at about 8:51 pm (CSB Volume 2, p. 28); the Chief Counsel’s data analysis identifies the first clear recorded anomaly at about 9:01 pm (p. 178). Under the CSB reconstruction, the influx developed for roughly 50 minutes before effective well-control action began (CSB Volume 1, p. 16).
The data showed it. The Chief Counsel’s Report traces the signs in sequence:
| Time (20 April) | What the data showed | What happened |
|---|---|---|
| 9:01 pm | Drill pipe pressure stopped falling and began to rise, with pump rate constant | Not noticed (p. 178) |
| 9:08 pm | About 100 psi rise on the drill pipe by now | Pumps stopped for a sheen test; returns routed overboard (p. 178) |
| 9:08 to 9:10 pm | Flow out continued about a minute longer than normal after the pumps stopped | Visual check on camera showed no flow; no second check (p. 178) |
| 9:08 to 9:14 pm | Drill pipe pressure rose about 250 psi with the pumps off | Not noticed (pp. 179–180) |
| 9:30 to 9:38 pm | Pumps stopped again; drill pipe pressure rose about 550 psi, then about 600 psi; kill line pressure had reached about 800 psi by 9:27 pm | Discussed as an equipment problem; no flow check, no shut-in, no call to the mud logger or well site leader (pp. 180–182) |
| 9:40 to 9:43 pm | Mud overflowed onto the rig floor | First well control action (p. 182) |
Two things made the signs hard to see. Overboard routing bypassed the pits, one flow-out meter and the gas sensors (pp. 178–179). And simultaneous operations, including pit transfers, seawater taken from the sea chest and crane work, made pit volumes hard to read (pp. 182–184). There were no automated alarms or volume calculations (pp. 184–185).
As a former mud logger, I read this table with a particular discomfort. A sustained pressure anomaly at constant pump rate demands explanation; pressure building while the pumps are off is even harder to dismiss. In the Macondo data, those trends were consistent with fluids moving in the well, and they did not need a pit gain to be taken seriously.
The engineering lesson: the report concludes the crew had enough time to shut in the well before hydrocarbons reached the riser, had the kick been recognized (p. 182). At Macondo, the investigators concluded that the conservative response to the unexplained indications should have been to stop the operation and secure the well before continuing the diagnosis (p. 198).
Line of defence 4: the response and the BOP (the last physical barrier)
By the time the crew acted, hydrocarbons were already above the BOP and rising in the riser (Chief Counsel’s Report, p. x). Mud shot about 200 ft up the derrick (p. 195).
Diverting to the wrong place
The crew activated the diverter, but its valves were set to send the flow to the mud gas separator rather than overboard, and they were not changed (pp. 195–196; CSB Volume 1, p. 17). The separator is sized for gas circulated out in a controlled kill, not for a blowout. It was overwhelmed, and gas came out onto the rig at several points (CSB Volume 1, p. 30). The Chief Counsel’s team found that, in those circumstances, diverting overboard would likely have sent much of the gas away from the rig and bought time; Transocean’s procedure placed the overboard line only at the ninth step (pp. 199–201).
Closing the BOP
The upper annular closed at about 9:43 pm but did not seal, most likely because the flow eroded the rubber (CSB Volume 2, pp. 29–30). A pipe ram then sealed the well at about 9:47 pm, and the first explosions followed at about 9:49 pm (p. 30). After the explosions, the emergency disconnect button was pressed, but there is no indication it worked (p. 30).
The blind shear ram, the last device that can cut the pipe and seal the well, closed later, most likely through the automatic deadman system (pp. 33–34). It did not seal. The CSB found that the drill pipe was off centre in the BOP, so the rams caught it at the edge, partly cut and punctured it, and left a flow path (pp. 32, 41–45).
Why the pipe was off centre
This is the CSB’s most important technical finding, and it is a mechanics lesson. After the pipe ram sealed the well, the pressure inside the drill pipe was far higher than the pressure outside it. That internal and external pressure difference created an “effective compression” loading condition capable of buckling the drill pipe, even though conventional compressive weight from above was not the controlling mechanism (CSB Volume 2, pp. 43–44). The CSB’s most likely scenario is that the pipe buckled in the minutes after the pipe ram closed, before the first explosion (pp. 32–33). Earlier investigations had assumed the pipe bent days later (p. 43).
The deadman system itself had problems. Only one of the two redundant control pods could function that day (pp. 14–15). The blue pod could not fire because faulty wiring had drained its battery. The yellow pod had a miswired solenoid, and it probably worked only because a failed battery had left one of two opposing coils inoperable (pp. 36–40). Neither industry practice nor US regulations at the time required the deadman system to be tested (pp. 16, 34).
The engineering lesson: a BOP’s effectiveness depends not only on its design and condition but also on timely activation and the well conditions it faces when called upon. Early kick detection keeps the influx smaller and gives the well-control system a much more manageable problem.
What a student or young engineer should take from Macondo
- The window drives everything. A 0.5 ppg margin at 18,000 ft shaped the cement design, the circulation and the risks taken. Learn to read a pressure window before you learn anything else about well design.
- A barrier is only as good as its verification. Placement indicators show that cement was pumped as intended; barrier integrity still requires appropriate verification, such as pressure testing and, where warranted, cement evaluation.
- Write down the expected answer before every test. Expected pressures, volumes and bleed-backs turn “flow or no flow” into an engineering check.
- Two gauges on one system should tell a consistent story. A difference between them is information, not noise, until it is explained. The pressure-balance logic on the Macondo drill pipe resembles SIDPP on a shut-in kick.
- Do not remove a barrier before the next one is in place. Displacing to seawater before the surface plug placed heavy reliance on a cement job that had not been proven.
- At Macondo, securing the well should have come before the diagnosis. Every minute spent discussing an anomaly let the influx grow and move up the well. On any rig, the response follows the approved well-control procedures.
- Safeguards fail in sequence. The CSB treats barriers as technical, operational and organisational elements to be managed as safety critical, with performance standards and verification (CSB Volume 2, pp. 47, 58–61). Macondo progressed because multiple independent technical, operational and organisational safeguards failed or were ineffective in succession.
Case Files take a public incident report and read it as a well engineer. Corrections are welcome through the contact page.
Sources
- National Commission on the BP Deepwater Horizon Oil Spill and Offshore Drilling, Macondo: The Gulf Oil Disaster, Chief Counsel’s Report (2011). Cited as “Chief Counsel’s Report” or by page alone.
- US Chemical Safety and Hazard Investigation Board, Investigation Report Volume 1: Explosion and Fire at the Macondo Well (2014).
- US Chemical Safety and Hazard Investigation Board, Investigation Report Volume 2: Technical findings on the Deepwater Horizon blowout preventer (2014).
Page numbers refer to the printed page numbers of each report.